- DATE:
- AUTHOR:
- Quantive Product Team
- RELATED ROADMAP ITEMS:
- KPI Projections
Introducing KPI Projections in Quantive Results
KPIs are the primary way for companies to measure their success and set their targets. Therefore they are key in the forming, implementation, and measurement of an OKR strategy. We are excited to announce the release of an updated KPI Modal, KPI Charts and KPI Projections. These improvements are targeted at improving the user experience for all accounts with access to KPIs within their plan.
What's new?
We have made some updates to the user experience while working with KPIs in the Quantive Results platform. Firstly, we have updated the KPI modal to give a better overview of your most important KPIs.
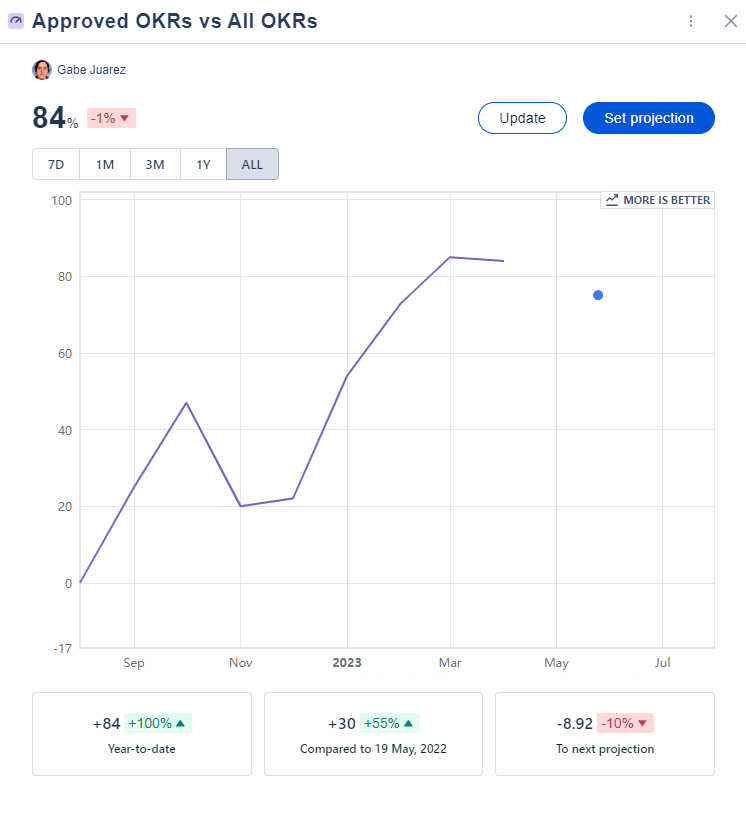
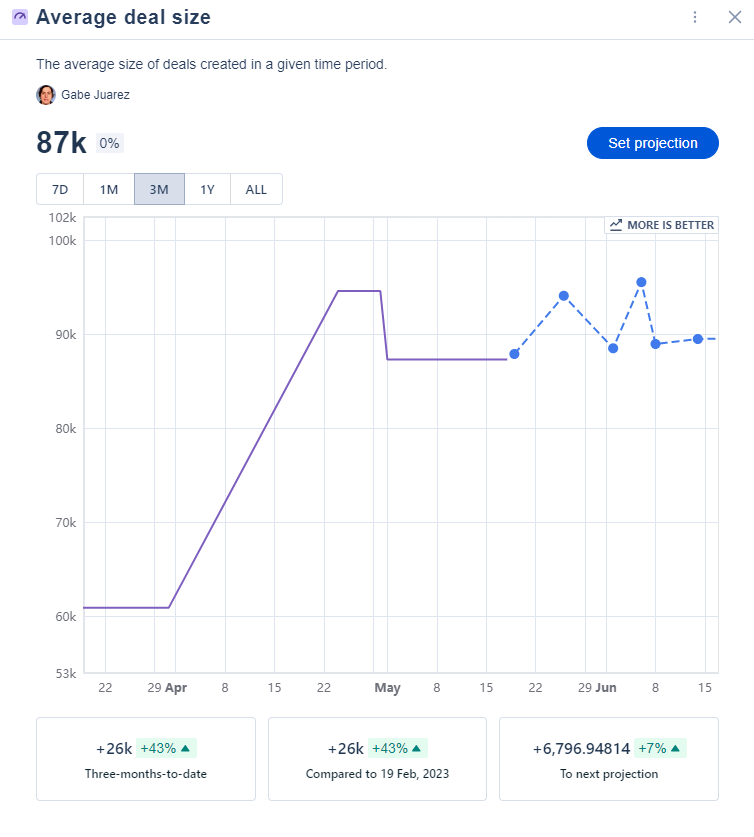
Secondly, we have introduced easy-to-read KPI Charts with date selectors, that aid users in identifying trends and patterns over a specific time period, beyond just the numerical updates.
Finally, we have introduced KPI Projections which allow you to set your expectations for the results of a KPI and visualize it in a chart. The individual KPI projections will form a projection line that clearly communicates to the KPI owners the desired outcomes at specific time intervals.
Want to learn more?
To find out more about the updates, or to learn how to set a KPI Projection, visit our help article on setting up KPI Projections.